Scenario Diagrams for Specific Tests
In order to better understand what calculations and scenarios to consider in our tool’s transfer functions, we constructed scenario and decision tree diagrams for a vibration test to help us to understand the potential for a cyclic and iterative process if a product were to fail a test multiple times.
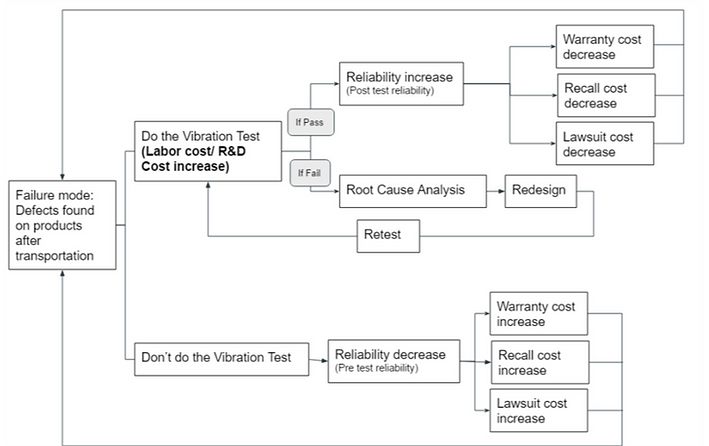
The above Scenario Diagram for a Vibration Test shows that:
Products Pass the Test
It’ll decrease the financial exposure costs
(costs associated with warranties, recalls, and lawsuits).
Products Fail the Test
This would continuously drive up the total test cost due to costs associated with redesigning and retesting, but would ultimately result in a reduced financial exposure cost if the product ultimately passed the test.
No Test Conducted
The Financial Exposure would eventually increase.